|
All checks were successful
Build, Test, and Upload Python Package / deploy (push) Successful in 42s
|
||
|---|---|---|
| .forgejo/workflows | ||
| docs/img | ||
| src/nqrduck_broadband | ||
| .gitignore | ||
| CHANGELOG.md | ||
| LICENSE | ||
| pyproject.toml | ||
| README.md | ||
NQRduck Module: nqrduck-broadband
A module for the nqrduck project. This module is used for broadband magnetic resonance experiments.
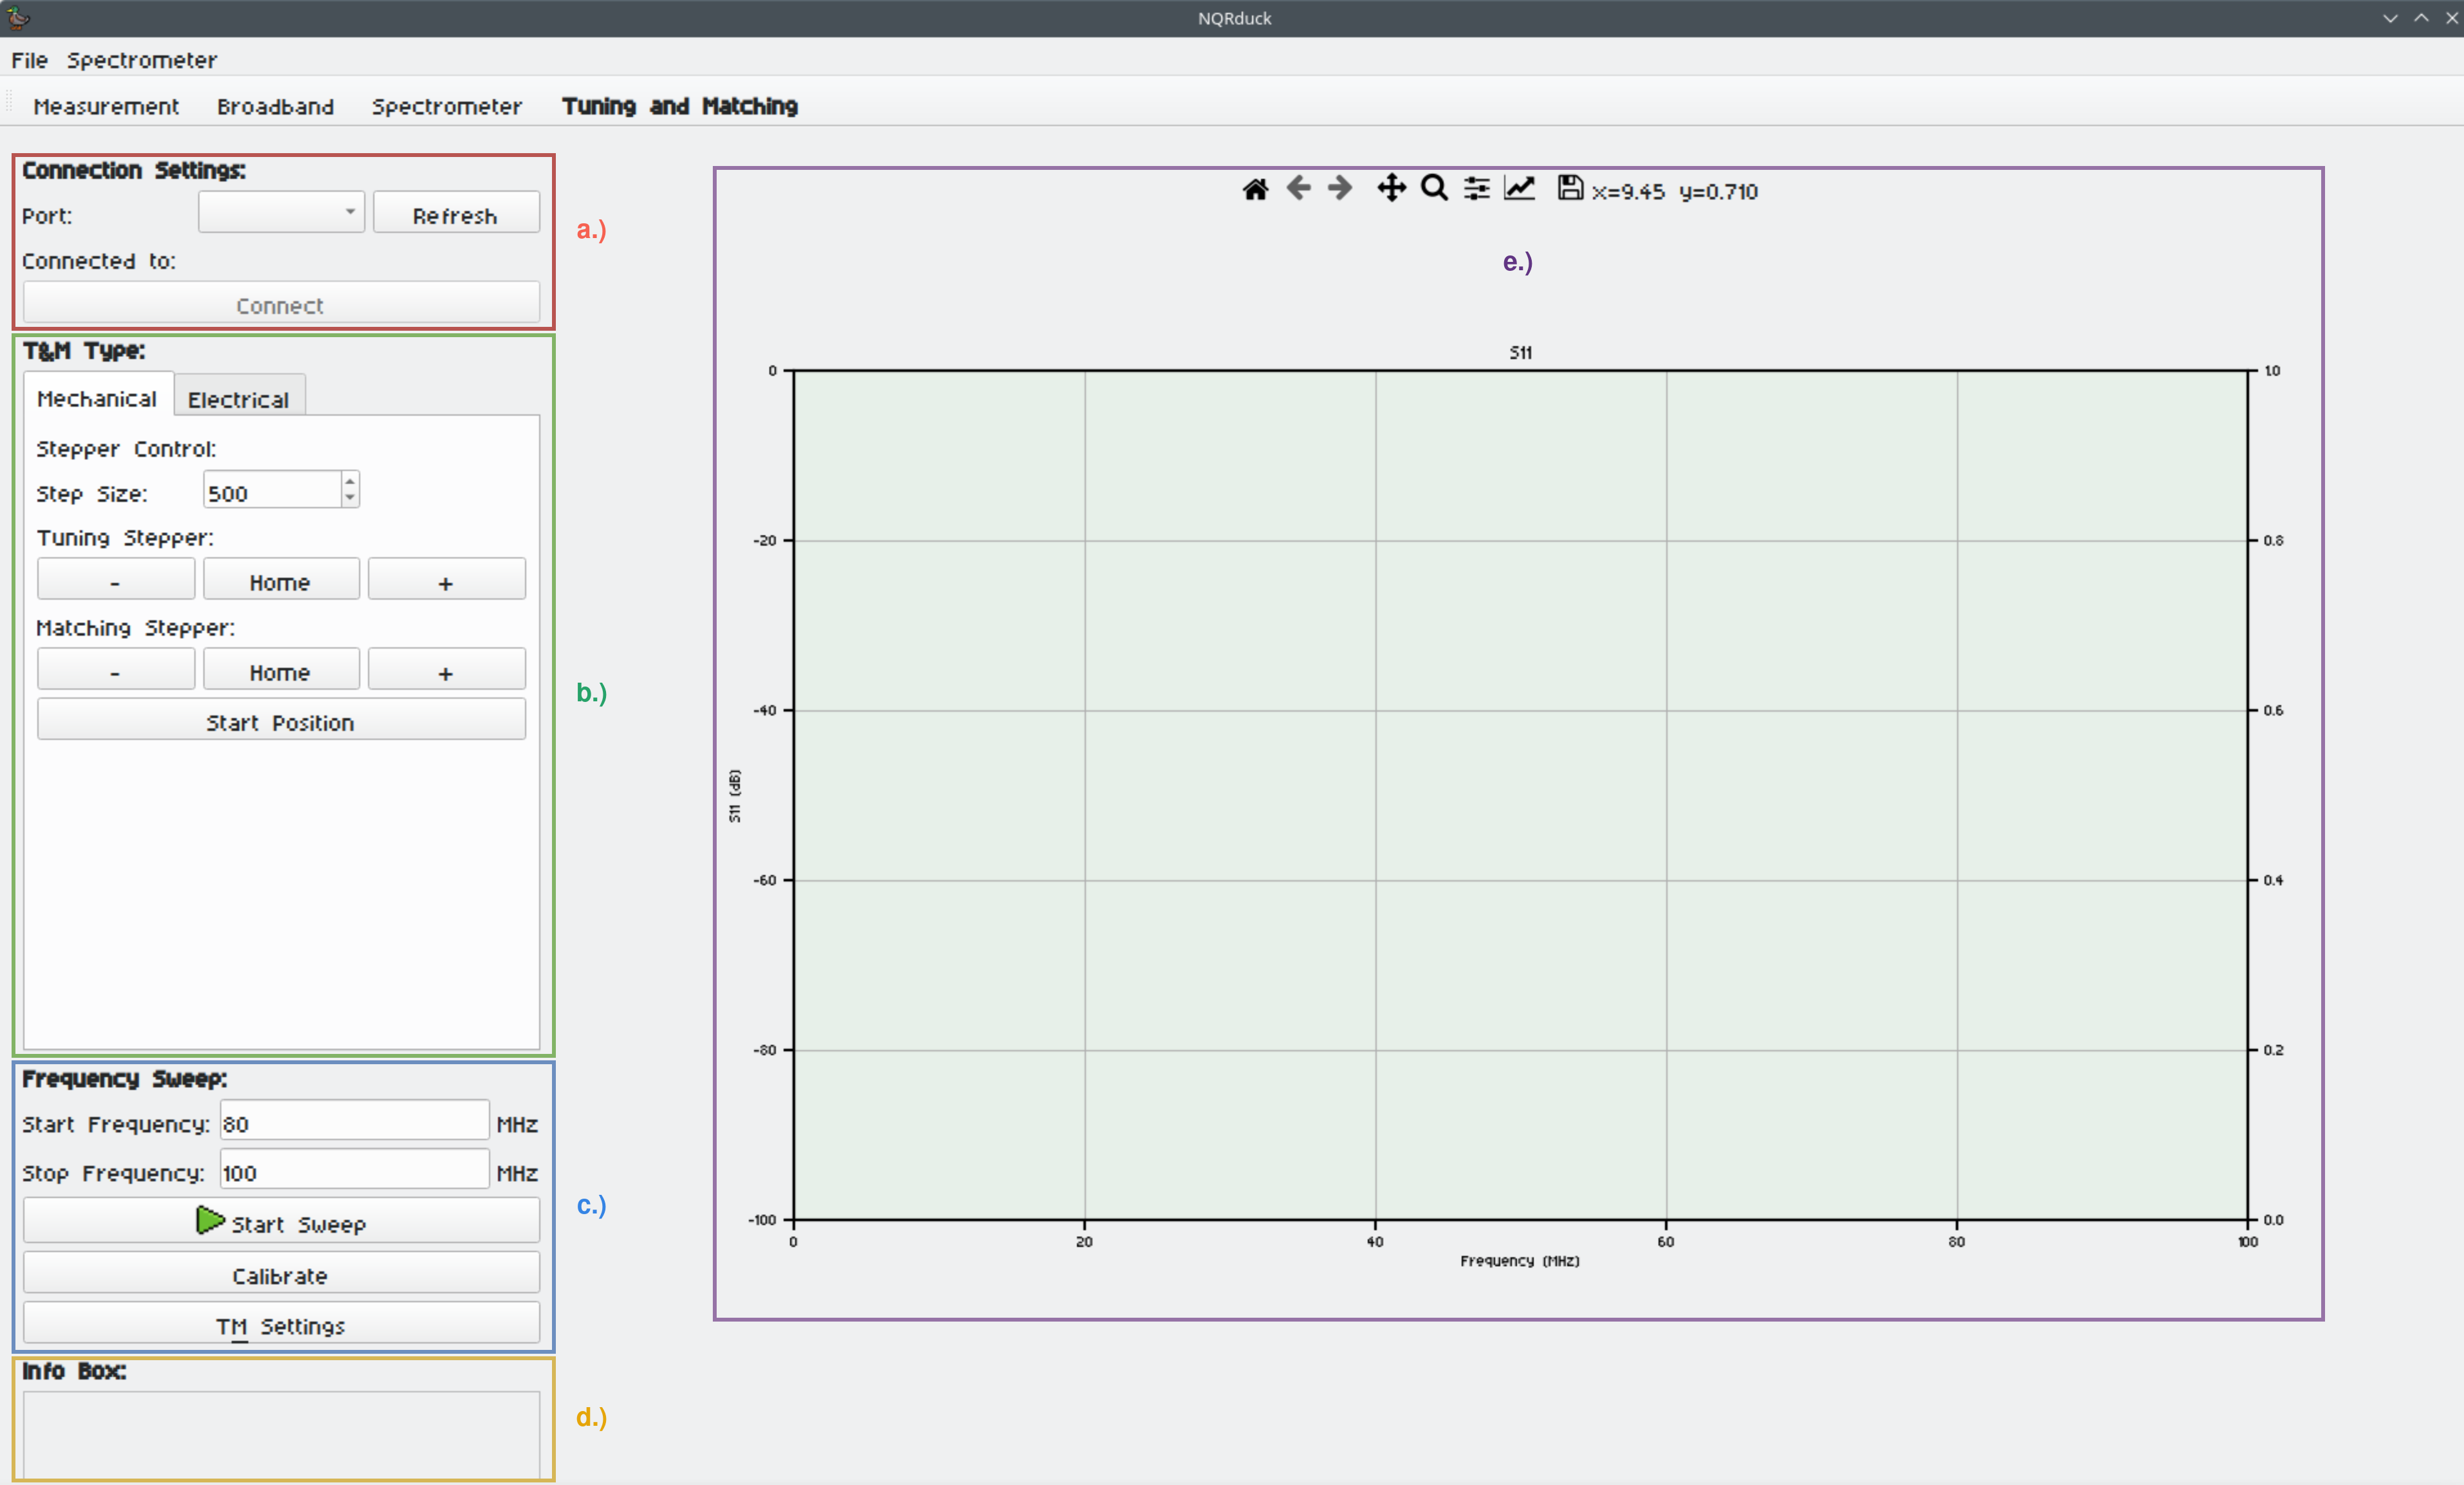
Tuning and Matching is done using the ATM-system in combination with the nqrduck-autotm module.
For mechanically tunable probe coils stepper motors for Tuning and Matching are used. For electrically tunable probe coils varactor diodes are used. The system is able to output a Tuning and Matching voltage in a range from 0 to 5V.
Installation
Requirements
Dependencies are handled via the pyproject.toml file.
Setup
To install the module you need the NQRduck core. You can find the installation instructions for the NQRduck core here.
Ideally you should install the module in a virtual environment. You can create a virtual environment by running the following command in the terminal:
python -m venv nqrduck
# Activate the virtual environment
. nqrduck/bin/activate
You can install this module and the dependencies by running the following command in the terminal while the virtual environment is activated and you are in the root directory of this module:
pip install .
Alternatively, you can install the module and the dependencies by running the following command in the terminal while the virtual environment is activated:
pip install nqrduck-broadband
Usage
The module is used with the ATM-system in combination with the nqrduck-autotm module.
Depending on what kind of probe coil is used you can generate a Lookup Table for a certain frequency range using the 'Tuning and Matching' tab. If you are using a low Q broadband probe coil you don't have to generate a Lookup Table.
The pulse sequence and spectrometer settings can be adjusted using the 'Spectrometer' tab.

- a.) The measurements settings with the frequency range and the number of steps. These settings are locked when generating a Lookup Table.
- b.) The information about the active Lookup Table.
- c.) The 'Broadband Plot'. Here the measured data is displayed. The plot is separated into the full broadband magnitude plot, the last time domain plot and the last frequency domain plot.
- d.) The 'Info Box'. Here information about the current status of the broadband measurement is displayed.
Notes
- The active user needs to be in the correct group to use serial ports for the ATM-system. For example 'uucp' in Arch Linux and 'dialout' in Ubuntu.
License
This project is licensed under the MIT License - see the LICENSE file for details
Contributing
If you're interested in contributing to the project, start by checking out our nqrduck-module template. To contribute to existing modules, please first open an issue in the respective module repository to discuss your ideas or report bugs.